Using Analytics to Improve the Support to Cultural Heritage Professionals
A Digital Analytics Case Study

2-minute read
OVERVIEW
Our team of 4 grad students at the Pratt DX Center partnered with the Digital Preservation Outreach & Education Network (DPOE-N) to find ways to increase their reach to professionals in need of professional development and funding support. We performed a digital analysis on their website and social media platforms using Google Analytics, LinkedIn Analytics, Twitter Analytics and Facebook Insights.
Key takeaways:
Twitter performed the best in impressions and engagements when compared with their other social media platforms. Tweets with media were engaged with the most, especially if they included announcements to upcoming workshops which really increased engagement with twitter users. Twitter was also bringing in the most visitors to the website (compared to their other social media platforms). We recommended that DPOE-N 1). prioritize Twitter as a marketing tool, 2). include impactful images along with their tweets, and 3). leverage the popularity of their workshop series on Twitter to drive more traffic to the site.
Since providing these recommendations, Twitter referrals to the DPOE-N website have gone up 85%.
We found that previous ad campaigns with in-industry organizations were successful at driving traffic to the site, and we recommended a number of other referring organizations that could be considered for future collaborations.
The Workshops page was gaining more popularity than their other pages, but we also noticed an unusually high bounce rate. This could be due to a banner image at the top of the page which looks like a button to apply for the workshop, but is instead a static image. We hypothesized that users could be exiting the website after failing to find a way to apply, and recommended that DPOE-N replace these banners with clickable links instead. They were able to implement these changes shortly after our meeting with them.
8-minute read
BACKGROUND
How can we increase the reach to professionals in need?
The DPOE-N was created in 2010 by the Library of Congress to provide digital preservation training, emergency hardware support, and funding support to cultural heritage professionals. Because of this mission, it is critical that they have a wide and effective presence in the digital spaces these cultural heritage professionals occupy and utilize. Their website and social media platforms serve as a tool to reach these professionals and to invite them to apply for funding and aid from the DPOE-N, and to market their workshop and training opportunities.
Our team of 4 grad students worked with representatives of DPOE-N to perform this digital analysis. For the scope of this project, 5 platforms were analyzed: DPOE-N’s website, and their social media accounts for Twitter, Facebook, Instagram and LinkedIn. This analysis helped in determining website visitor behavior, successful social media platforms and high performing social media content.
Our primary goal for this analysis was to determine how to increase the organization’s reach to professionals in need of professional development and funding support, and more broadly find ways to grow their current audience.
Timeline:
3 weeks (June 2nd - June 23rd, 2021)
Our Team:
Jessika Davis, Prachi Chhajed, Cameron Dudzisz & Myself
My Role:
Analyze social media data; create data visuals in Tableau; report writing; present findings
Deliverables:
Digital Analytics Report; Google Data Studio Dashboard; Findings Presentation
OUR PROCESS
How we analyzed the data.
An initial interview was conducted with the organization to capture their current state analytic processes, identify targeted audiences, and understand their main objectives with the website usage as it aligns with their own mission to support digital preservation education and outreach in the nation’s libraries, archives and museums. My primary role in this analysis was to focus on comparing social media data and to do a deeper level content analysis on the social media platform that was most successful.
-
We looked at DPOE-N Website, as well as their main social media platforms Twitter, Facebook, Instagram and LinkedIn
-
Website: October 7, 2020 - June 19, 2021
We wanted to look at their total historical website data so we looked at their website launch to date of project kickoff.
Social Media: February 1 - June 19, 2021
Again, we wanted analyze as much historical data as we could so we looked at the date of their last launched social media platform to date.
-
Data Collection & Analysis: Google Analytics, Twitter Analytics, Facebook Insights, and LinkedIn Analytics
Data Transformation & Visualization:
Google Sheets for collecting and transforming data; Google Data Studio for dashboard reporting; Tableau for created more in depth visualizations
-
Website:
Unique pageviews, sessions, time on page, bounce rate and users
Social media:
Impressions, engagements and engagement rate
WEBSITE FINDINGS
What’s driving visitors to the website?
When looking at the data from website launch to date, the trend line in Fig. 1, below, demonstrates incremental growth in sessions to the website over time. Our first question was to understand where site visitors are coming from and what’s driving them to the site?
Figure 1. Sessions by month
Top 3 Traffic Sources: Direct, Google & Twitter
We found that the top 3 sources driving traffic to the website (by sessions) is direct traffic (65%), traffic by Google (20%) and traffic from Twitter (3%) (see Fig. 2).
Direct traffic generates more than half of the websites total traffic, an unusually high number of sessions from this source. This can have multiple causes: the site visit generates from a book marked link, the site is being visited through marketing blasts (the link is being shared without campaign tracking), and/or the site’s web address is being typed directly into the browser (strong indication of self-generated traffic).
The second highest, Google (20%), refers to visitors coming directly from Google’s search engine. At a lower percentage (3%), Twitter comes in third as one of the key website referrals, the highest source out of the social media sources.
Figure 2. Traffic by source/medium
Ad Campaigns are Working
DPOE-N shared that they had an ad run on the website for Society of American Archivists (SAA) (website= www2.archivist.org and connect.archivist.org) for the past 6 months. When looking at the data prior to this 6 month ad campaign (Nov 19 - Dec 19, 2020) compared to the time period during the ad campaign (Dec 20, 2020 - May 21, 2021), it is evident this campaign boosted sessions to the site (see Figure 3). Sessions generated from SAA had increased significantly during the time of the ad campaign.
Figure 3. SAA ad campaign traffic
How are visitors interacting with web content?
After analyzing what sources bring visitors to the website, we wanted to then look at their behavior with the site’s webpages.
The Workshops Page is Gaining in Popularity
From the time of site launch to date, the top 3 pages based on unique pageviews were 1). the Home page 2). the Professional Development Funding page and 3). the Workshops page. The Home page comprised 28% of total unique pageviews, followed by Professional Development Funding (20%) and Workshops (13%).
However, in looking at the data from a more current perspective (May 21 - June 19, 2021) we found that the Professional Development Funding page in recent months only comprises 10% of total unique pageviews (see Figure 4). The Workshops and the Home page have a significantly higher percentage of pageviews in comparision, comprising 39% and 27% of the total respectively. This is concerning as the Professional Development Funding page houses the link to the Professional Development Funding Application, and generating pageviews to this page is crucial to realizing the organization’s objectives.
Figure 4. Unique Pageviews, Avg. Time on Page & Bounce Rate by Page Title (May 21 - June 19, 2021)
Unusually High Bounce Rates on the Workshops Page
The higher percentage of pageviews for the Workshops page is encouraging as it reflects positively on the organization’s mission to help support professional development. It can also reflect the success of social media promotion of upcoming workshop related events (as the Social Media Findings section will detail).
However, it’s concerning to see a higher bounce rate at 86% for the Workshops page, which might be explained by two things:
The heading of the page includes an image which looks like a button to apply, but is instead a static image (See Figure 5). It could be hypothesized that users are spending a longer time on the page to read through the copy in search for a way to apply (like a form, etc.)
The actual apply link (located at the bottom of the page) redirects the user to an outside page. Due to a lack of tracking set up for the DPOE-N website, Google Analytics will track clicks to that apply link as bounces which could be skewing the bounce rate.
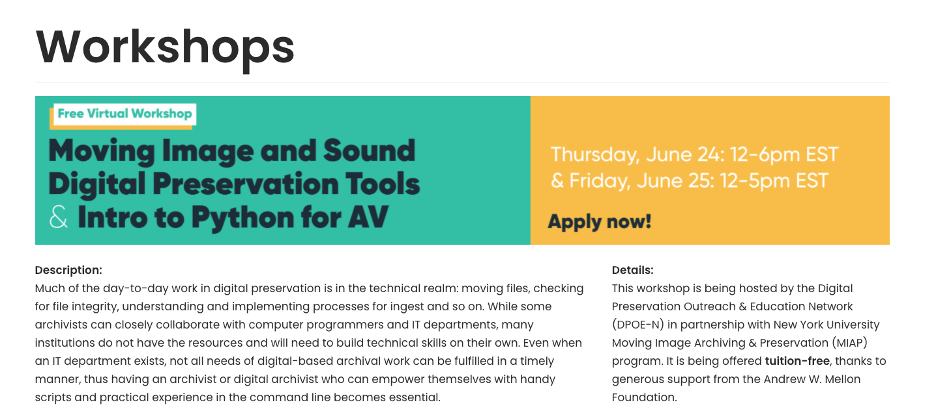
Figure 5. Static image as page header
RECOMMENDATIONS
How can they improve their web reach?
Highlight CTAs Better
Both the Workshops page and the Professional Development Funding page have CTA buttons to ‘Apply’ located on the bottom of the page below dense text copy. This could be influencing the number of visitors able to discover those applications and could be contributing to a higher bounce rates. We’d recommend bringing those CTA buttons to a more prominent placement at the top of the page.
Lean on Social Media
To drive more traffic to the website from non-direct sources, one approach would be to enhance the reach and engagement through their various social media platforms, particularly platforms like Twitter that has the potential to drive more sessions to the site (more discussion on this can be found in the Social Media Findings section below).
Collaborate with Referring Organizations
The campaign with the Society of American Archivists (SAA) demonstrates that targeted marketing and leveraging in-industry organizations does in fact yield results for generating website traffic. In our Evaluation Report we provided a breakdown of several other referral organizations that could spark opportunities for future collaborations, promotions, and advertising that could drive further traffic to the website.
Improve Search Engine Optimization
While a full-scale SEO audit was not the primary scope of this project, we discovered some areas for improvement to better optimize the site for search engines, like Google, which currently makes up 20% of the site's total sources. One recommendation is to remove images as headings on the Workshops page (as seen in Figure 5). While these images provide more visual appeal to the page, they are not optimized for search engines because website crawlers can’t read the text on these images. Textual headings (tagged as headings in HTML) provide crucial information to crawlers about the page and using images in their place limits the ability of crawlers to determine page content.
SOCIAL MEDIA FINDINGS
Which platform is most engaged with?
Seeing as Twitter generated the most traffic to the website, we wanted to understand how Twitter compared to the other social media platforms and which one was the most engaged.
Twitter for the Win
Our analysis discovered that Twitter was the most successful social media platform by a number of metrics (see Figure 8). Twitter was the leader in the number of followers (258), compared to LinkedIn (214), Facebook (209) and Instagram (95). Twitter was also the most utilized social media platform having 35 posts during this time period, in comparison to Facebook (18), Instagram (16) and LinkedIn (3). In terms of impressions, Twitter had on average 1,243 impressions per post, while Facebook had 209 impressions/post followed by LinkedIn at 166 (the analytics through Facebook Insights did not provide data on Instagram impressions). Twitter was also leading in engagements per post, with an average of 42 engagements per post in contrast to Facebook (14), Instagram (7) and LinkedIn (>1).
Figure 8. Social media KPIs by platform
Analyzing Twitter’s content.
Due to the success of Twitter compared to the other social media platforms, we decided to do a deeper level analysis of Twitter to further define which content is the most successful, as well as identify any areas for improvement.
Media is Driving Engagement
Media engagements take the lead in the different ways users engage with content on Twitter (see Figure 9). Twitter measures media engagements as the number of clicks on media, including videos, gifs, and images. We found that on average each tweet was garnering approximately 12 media engagements, far above the average likes (6) and retweets (2). Not every tweet by DPOE-N includes media content, and when removing those non-media tweets from the dataset, the average media engagement per tweet increases to approximately 18 engagements. In contrast, hashtag clicks comprise the lowest form of engagement. Twitter measures hashtag clicks as the number of clicks on hashtag(s) within a tweet. From our analysis period, we found that 57% of tweets included at least one hashtag, yet there was no engagement with any of the hashtags used.
Figure 9. Engagement type by tweet
Workshop Announcements are Popular
In looking at the timeline of engagements and tweets (see Figure 10), it’s clear that not all tweets perform the same. We analyzed the 5 highest performing tweets based on engagement and discovered that the top 3 tweets included announcements of upcoming workshops.
Figure 10. Engagements and number of tweets over time
The top 3 tweets also had the highest media engagement of all the tweets (an average of 96 media engagements per post), signaling successful use of graphic images within the tweet. When looking at the 5 lowest engaged tweets, we found that 2 of those tweets included DPOE-N funding recipient stories. These bottom 2 tweets also included graphic images, however the media engagement of these images was much lower (an average of 2.5 media engagements per post). When comparing the images of those tweets that perform the highest to those that perform the lowest, we can see those performing low include text heavy graphics with minimal visual design elements (Figure 11.1 & 11.2, most engaged images are on the left and least engaged are on the right).
Figure 11.1. Most engaged tweets
Figure 11.2. Least engaged tweets
RECOMMENDATIONS
How can they improve their reach through social media?
Prioritize Twitter
Twitter is the most successful social media platform for DPOE-N and should be given greater priority in the organizations social media strategy, while non-Twitter social media should be used as support platforms to Twitter. Although they do not receive as much traffic as Twitter, the other social media platforms have their own unique features that can and should be utilized.
Use Impactful Images by Limiting Text-heavy Graphics
The organization’s Twitter strategy should remain focused on producing high quality graphical images to accompany tweets, as it’s clear that media elicits more engagement. Text in images should be reduced to a minimum few key points, with clearer visual design elements to break up the text (varying fonts, colors, weight, etc.). When lengthier narration is needed, such as the case with the DPOE-N Funding Recipient stories, using Twitter threads could help tell a longer story in more tweets without overwhelming users with one text-heavy graphic. For these longer stories, several graphics could also be made to highlight key quotes of the recipient’s story.
Consider Expanding Hashtags
Due to the low engagements with hashtags, the current hashtag strategy should be reexamined. From our analysis, #dpoen and #digpres were found to be the most commonly used hashtags by DPOE-N. When looking at other accounts associated with the hashtag #digpres, we found that accounts commonly supplemented this hashtag with other more direct words like #archives or #digitalpreservation, and that #digipres was more commonly used than #digpres. We would also recommend using a variety of hashtags for things that could be tangentially related to the organization’s mission and could reach a broader audience. To be mindful of Twitter’s character limit, creative use of hashtags can be integrated within the body of the tweet, rather than added to the end of the tweet.
REFLECTION
From insights to implementation.
Some of our analysis corroborated with insights DPOE-N already had. They knew that their Workshops program was growing increasingly popular and this was better realized when seeing that this was the most engaged content on Twitter and the most visited page on the website in recent months. While happy with the Workshop popularity, they had been trying to generate more traffic the Professional Development Funding Application. The DPOE-N Principal Investigator was pleased with our recommendation to leverage the popularity of their workshops by including information on the Funding Application. They were also surprised with how well Twitter performed when stacked up to the other social media platforms, and questioned whether they should continue with paid marketing on LinkedIn in the future.
[Update March 2022]: Since our debrief, DPOE-N was able to implement the following recommendations we had given:
Remove images as headers on the Workshops page and replace those images with a clickable CTA button strategically placed at the top of the page, in an effort to reduce bounce rate and improve SEO of their website

Increase discoverability of the funding application by moving the ‘Apply’ button to the top of the Professional Development Funding page.

Use impactful images and leverage the popularity of their workshop series on Twitter by including information about funding applications to increase their reach to professionals in need. They’ve since seen an 85% increase in website referrals from Twitter.

My parting thoughts.
I like to end each case study with a section on what I’d do differently if I had to do it over:
To keep within the scope of our project, we decided to only do a deeper dive into Twitter as a social media platform given that it was the most engaged social media platform across the board. However, the client spent most of their marketing budget towards LinkedIn. If time permitted, it would have been helpful to have given a more thorough analysis of LinkedIn as well, so they could better justify (or not justify) their paid marketing on this platform.
Our Google Studio dashboard utilized the bright branding colors of DPOE-N nicely, but we could have utilized these bright colors more effectively by only adding pops of color to draw attention to important data points and muting the colors of less important data points.